
Node.js memory flamegraphs
If you read my blog or follow me on Twitter you may have noticed I'm a huge fan of flamegraphs. I've previously written about how I use them to profile PHP and Node.js applications, and I help maintain rbspy, a Rust profiler for Ruby, which outputs flamegraphs.
Most of my experience with them has been for CPU profiling. I was recently looking into a couple of Node.js applications and wondered if I could get the same output for memory usage. My go-to source for information about flamegraphs is normally Brendan Gregg's website. I found a page called Memory Leak Flame Graphs, but it's not particularly specific to Node.js and focusses on other things.
Having searched Google for hours, I was really struggling to find anything to do with Node.js memory flamegraphs. I found the heapdump library which allows you to dump a heap snapshot but I was struggling to find anything useful to do with it. I found out Chrome allows you to import the files, but you get given a huge tree structure with obscure titles -- not helpful.
On the verge of giving up, I looked into the feasability of writing a converter for heap snapshots --> flamegraphs. The heapsnapshot-parser library looked promising, and it managed to return the nodes and edges in the call-graph. But what next? I tried to look at how they linked together, but there were hundreds of thousands of nodes for very simple programs. The v8-profiler does some crazy things to the objects and the online documentation is pretty sparse.
Then I remember you could spin up Node with the --inspect flag and it'll allow you to debug via Chrome. I'm pretty sure I already tried this, but only managed to generate the same tree structure as earlier. Clearly I didn't look hard enough because I did manage to generate a flamegraph!
I'd actually recommend running Node with the --inspect-brk. It'll add a breakpoint at the beginning of your application so you can get everything else set up before continuing. It's also useful to click the little green button in the top-left of Chrome developer tools which spins out a dedicated instance of DevTools for Node.js.
node --inspect-brk index.js
You'll notice it drops you into the Sources tab with the debugger paused on the first line.
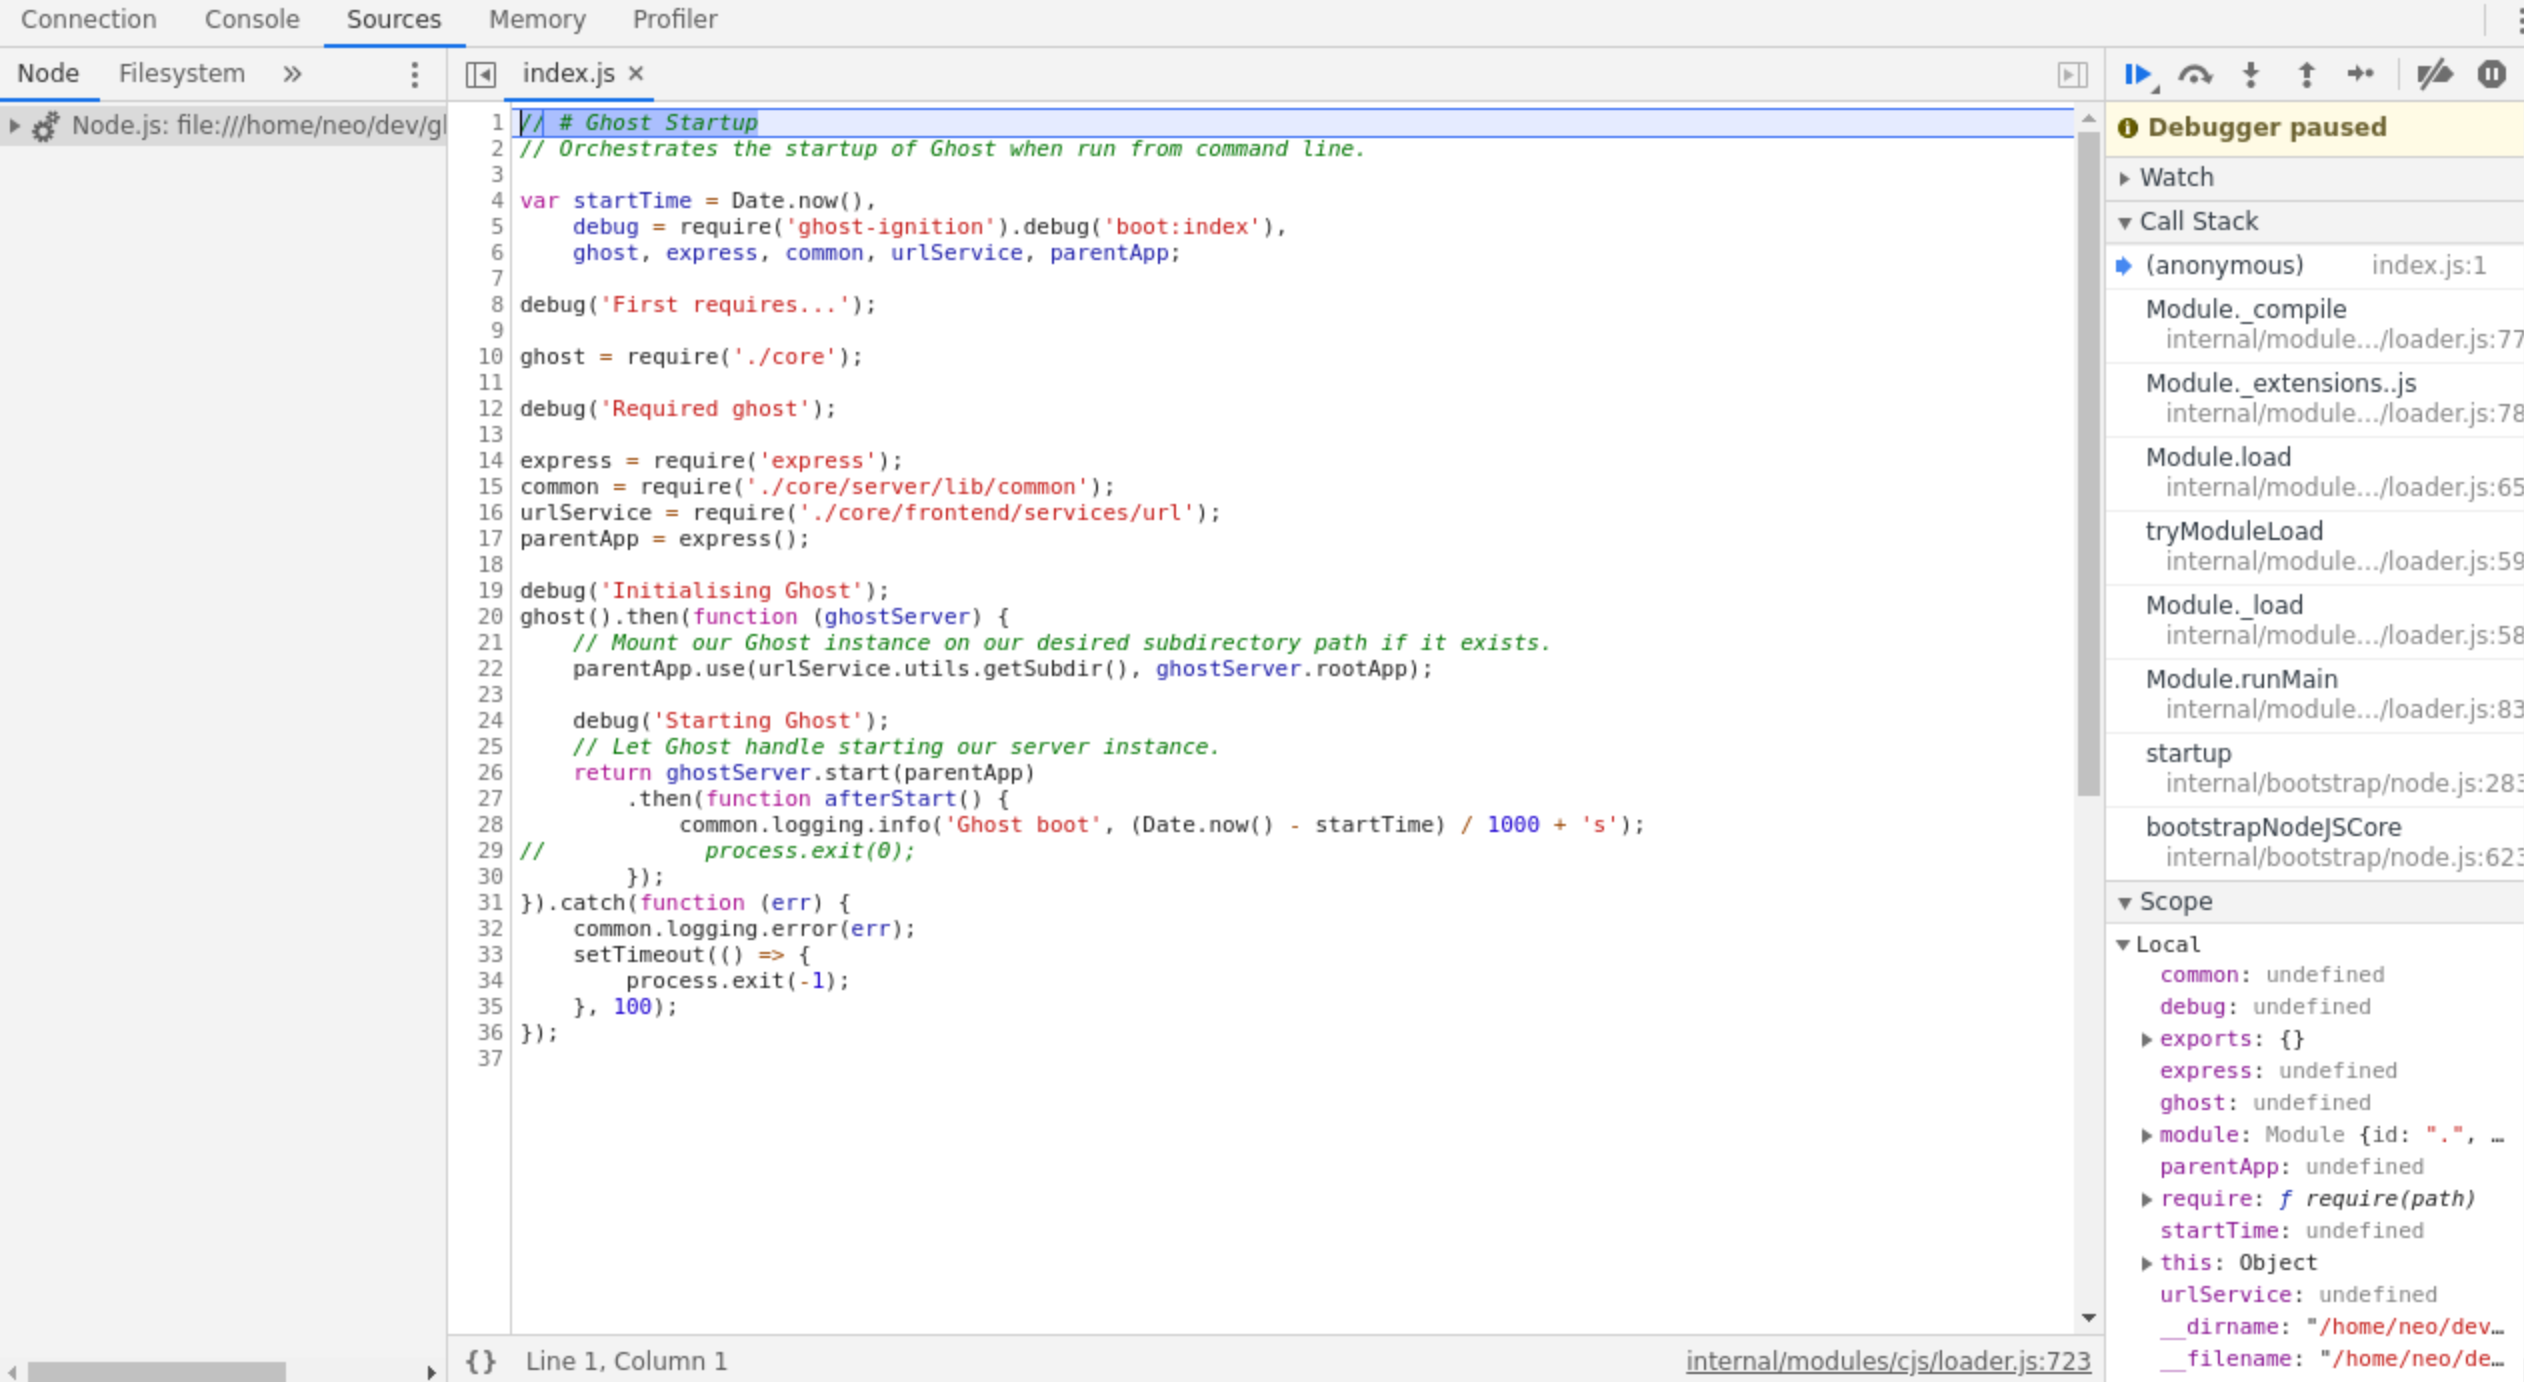
If you click the Memory tab, you can select the Allocation sampling option. Click Start at the bottom and it'll start profiling your application. It's not actually doing anything at the minute because your application is paused. Go back to the Sources tab and click the Play button to allow the debugger to continue.
Let your program continue until you've collected the data range you wanted. In my example, I wanted to get the memory usage for the original boot, so I stopped profiling after this point. If you were more concerned about profiling at a certain time in your application, you could set a breakpoint for that point and go from there. Bear in mind that the memory sampling process will cause your program to run slower, so I'd try and keep the operations light.
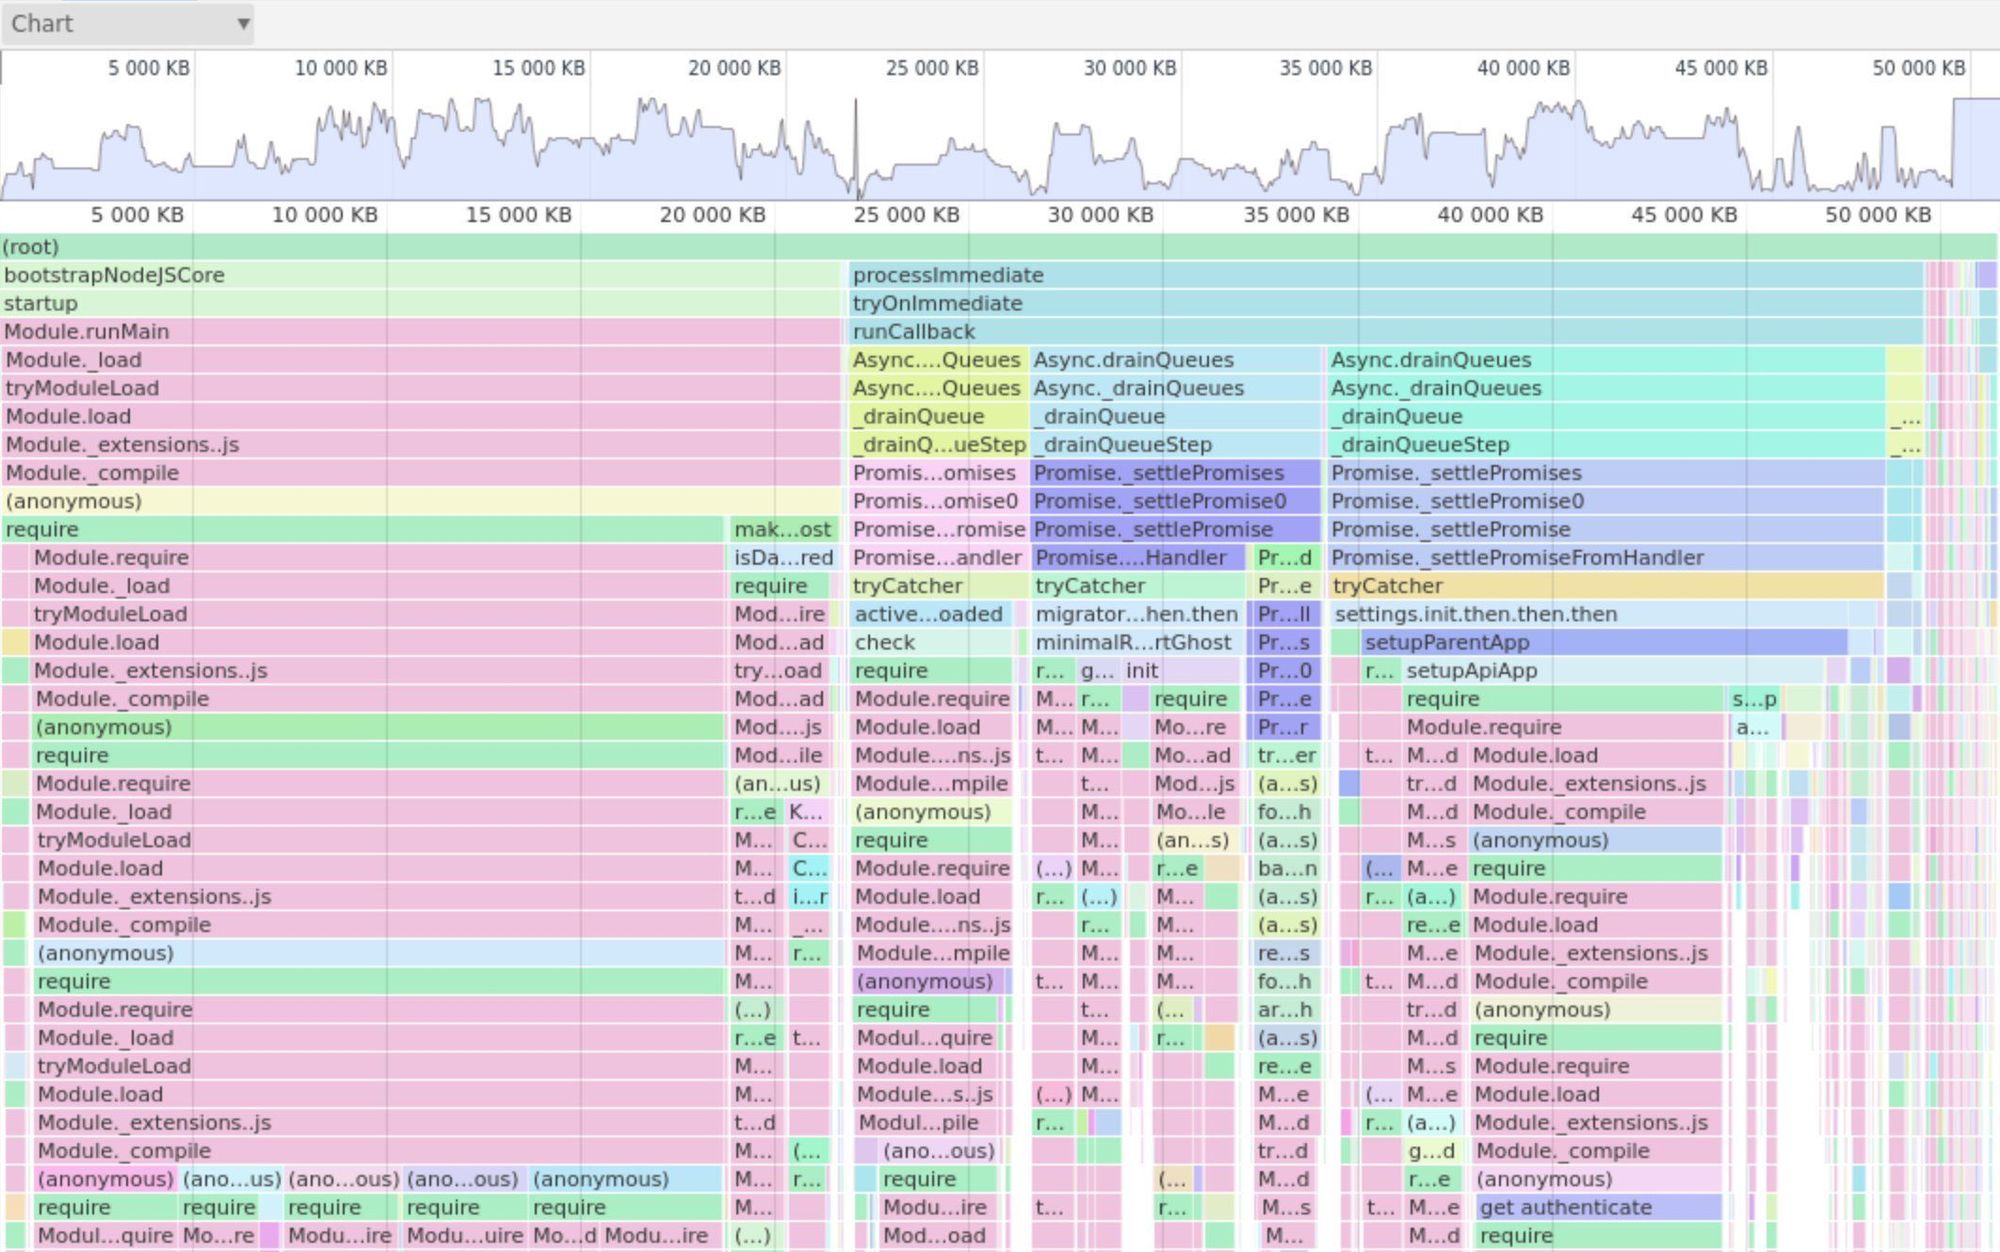
If you're not seeing the flamegraph in the Memory tab, click the dropdown in the top-left and choose Chart.

You can zoom + select the code paths you want. It's lacking search functionality but if you leave the Node process running, you can click on the boxes in the flamegraph and it'll open up the code associated with it.
In upcoming posts I'll talk more about profiling Node.js applications but for now, enjoy!