
Profiling Node.js applications using flamegraphs
This post is a case study of how I profiled a Node.js application, and how using flamegraphs allowed me to make the boot time of Ghost 20% faster.
I remember trying to profile Node.js many years ago and it was much harder than it is now. When researching what was now available, I found 0x, a single-command flamegraph profiling tool. I love flamegraphs, and this tool looked great, so I took it for a spin on Ghost.
I wanted to walk through an example of a recent optimization, so you can see my methodology and apply it to your own programs. If you find this post useful, I'd love to hear from you on Twitter or email!
The pull request I sent to Ghost can be seen here.
I knew boot times were important to the Ghost team for their Pro platform. I wanted to see if there was anything I could improve.
It was important the data I collected was just for the boot, and not the idle time waiting for connections. Instead of manually pressing Ctrl+C to end the program, I inserted a call to immediately kill the server after boot.
diff --git a/index.js b/index.js
index a25ece9f1..03e54bb5e 100644
--- a/index.js
+++ b/index.js
@@ -26,6 +26,7 @@ ghost().then(function (ghostServer) {
     return ghostServer.start(parentApp)
         .then(function afterStart() {
             common.logging.info('Ghost boot', (Date.now() - startTime) / 1000 + 's');
+            process.exit(0);
         });
 }).catch(function (err) {
     common.logging.error(err);
Running node index.js booted the server, and then it immediately shut down. Running it a few times, I was able to see the time it took - around 2.1 seconds on my laptop.
We run 0x by prepending it to the command above - 0x -- node index.js. A flamegraph is generated and you can open this in your browser. I like to enable Tiers and disable core and inlinable, leaving just app and deps. That allows me to see the things I can change easier.
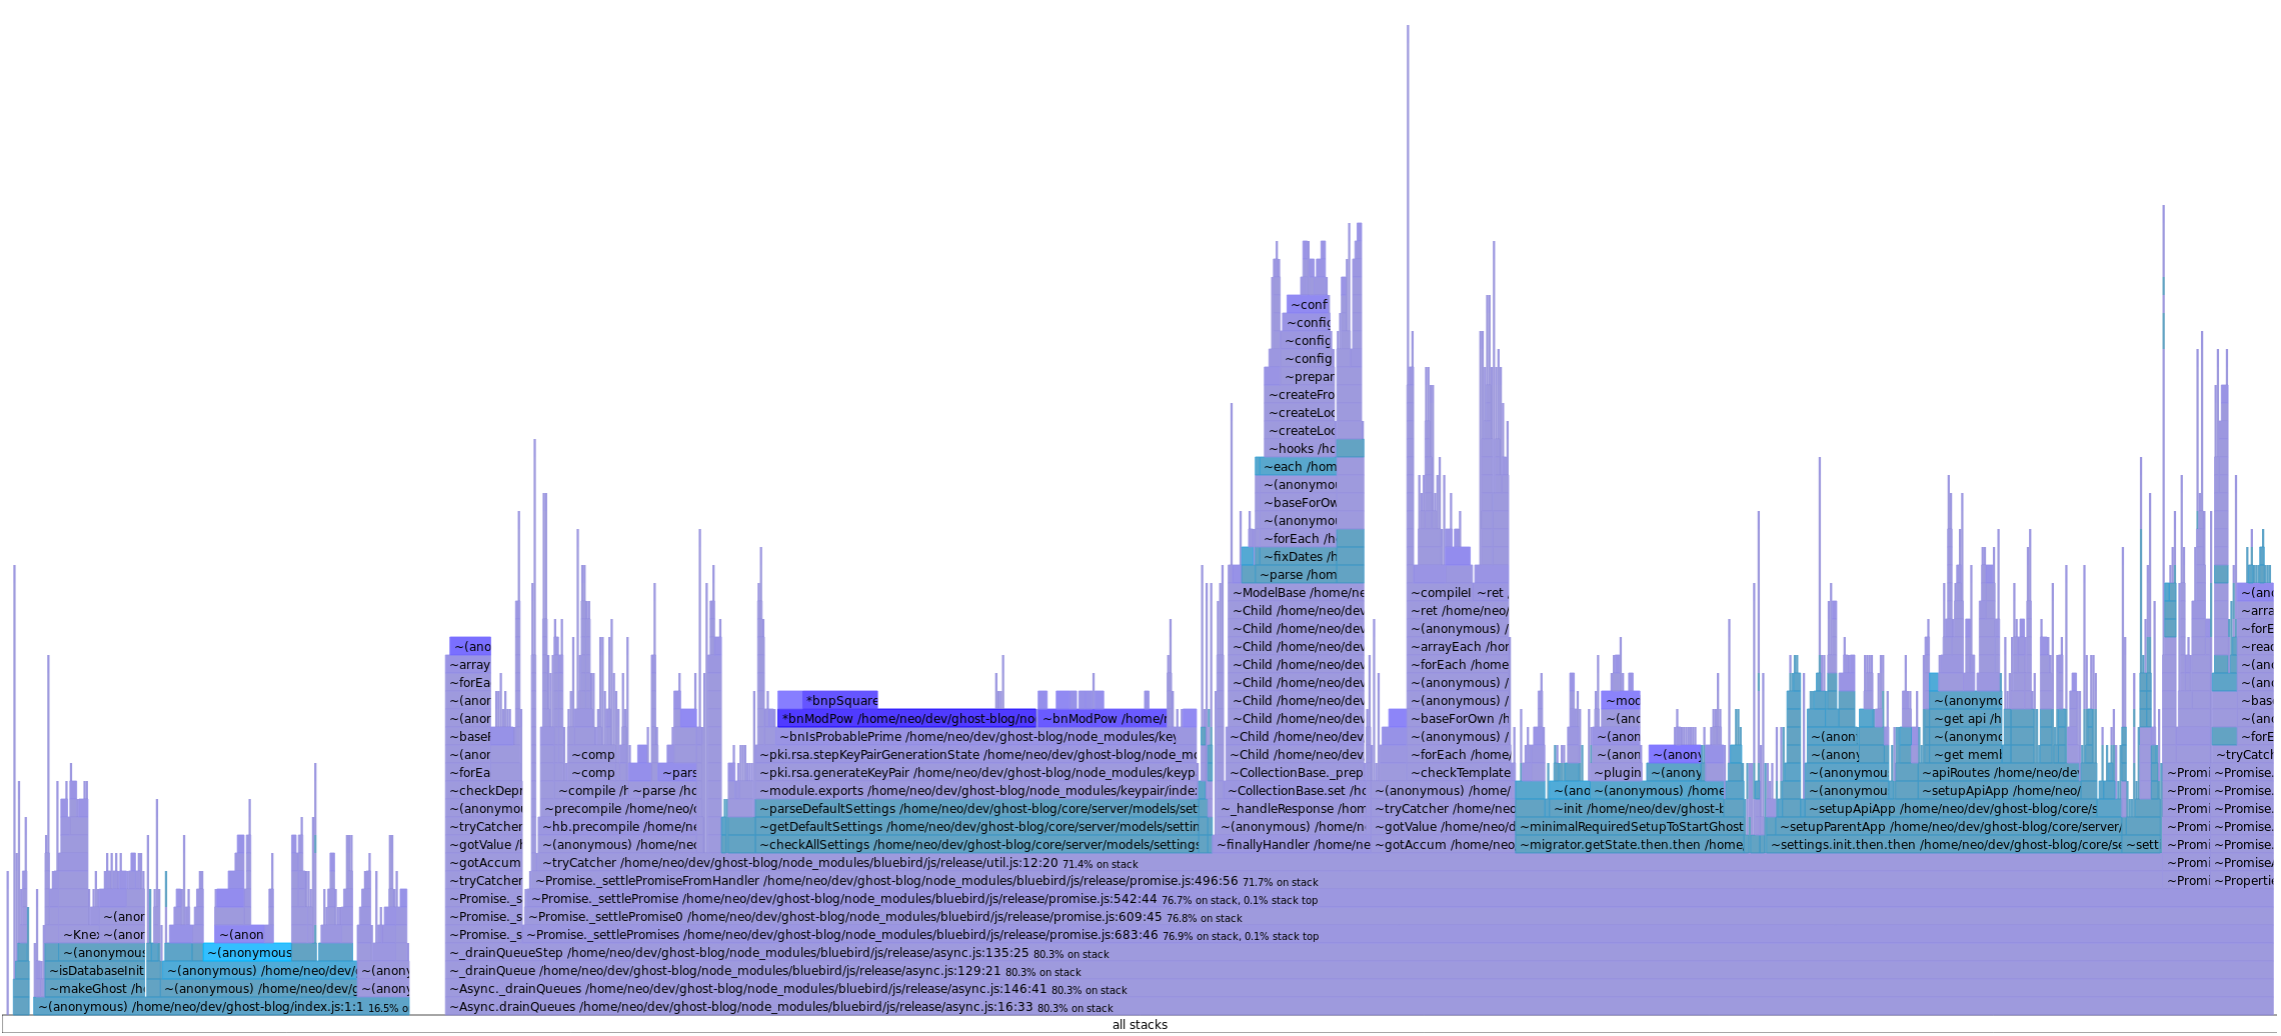
In case you're not familiar with flamegraphs, the x-axis is the population of samples, sorted and grouped, and the y-axis is the stack trace. So whilst the x-axis is not time, it's roughly similar. When looking at flamegraphs, you want to be looking for the wide sections, because that's where a lot of time is spent and would benefit most from optimizing.
The purple in the flamegraph above indicates dependency code, and the blueish color is our own code. The dark blue indicates very heavy sections. This flamegraph is a little odd because they use a lot of Promises and so the chain between the parent code and the async callback is missing but you can still get a grasp of what is going on.
So looking at the image, you can see the wide, flat section just left of the centre. Some of the function names are generateKeyPair so I had a feeling it was something to do with cryptography. Going to that section in the code, you can see the following call:
const membersKeypair = keypair({
    bits: 1024
});
Ok, it definitely looks like some crypto code. Taking a look at keypair, it turns out it's implemented entirely in JavaScript. They have a section in their README, under Performance, saying "With 1024 bits you get a key in 0.5s-2s". Eek, a bit slow. JavaScript-only crypto libraries do tend to be a little slow, so I had a look for faster ones.
For brevity, I'm missing out all the other libraries I tested, but I ended up finding rsa-keypair. It was a Node.js extension written in C++, using the native OpenSSL crypto library. I benchmarked it against the current library and rsa-keypair was much faster.
var Benchmark = require('benchmark');
var keypair = require('keypair');
var rsaKeyPair = require('rsa-keypair');

var suite = new Benchmark.Suite;

suite
.add('keypair', function() {
    const pair = keypair({bits:1024});
    var _ = pair.public;
    var _ = pair.private;
})
.add('rsa-keypair', function() {
    const keys = rsaKeyPair.generate(1024);
    var _ = keys.publicKey;
    var _ = keys.privateKey;
})
.on('cycle', function(event) {
    console.log(String(event.target));
})
.on('complete', function() {
    console.log('Fastest is ' + this.filter('fastest').map('name'));
})
.run({ 'async': true });
The output:
keypair x 3.99 ops/sec ±34.45% (15 runs sampled)
rsa-keypair x 48.53 ops/sec ±8.31% (23 runs sampled)
Fastest is rsa-keypair
Great! It seemed to produce what we needed so I quickly switched it out. (The actual changes I made can be seen here.) So how does the flamegraph look now?
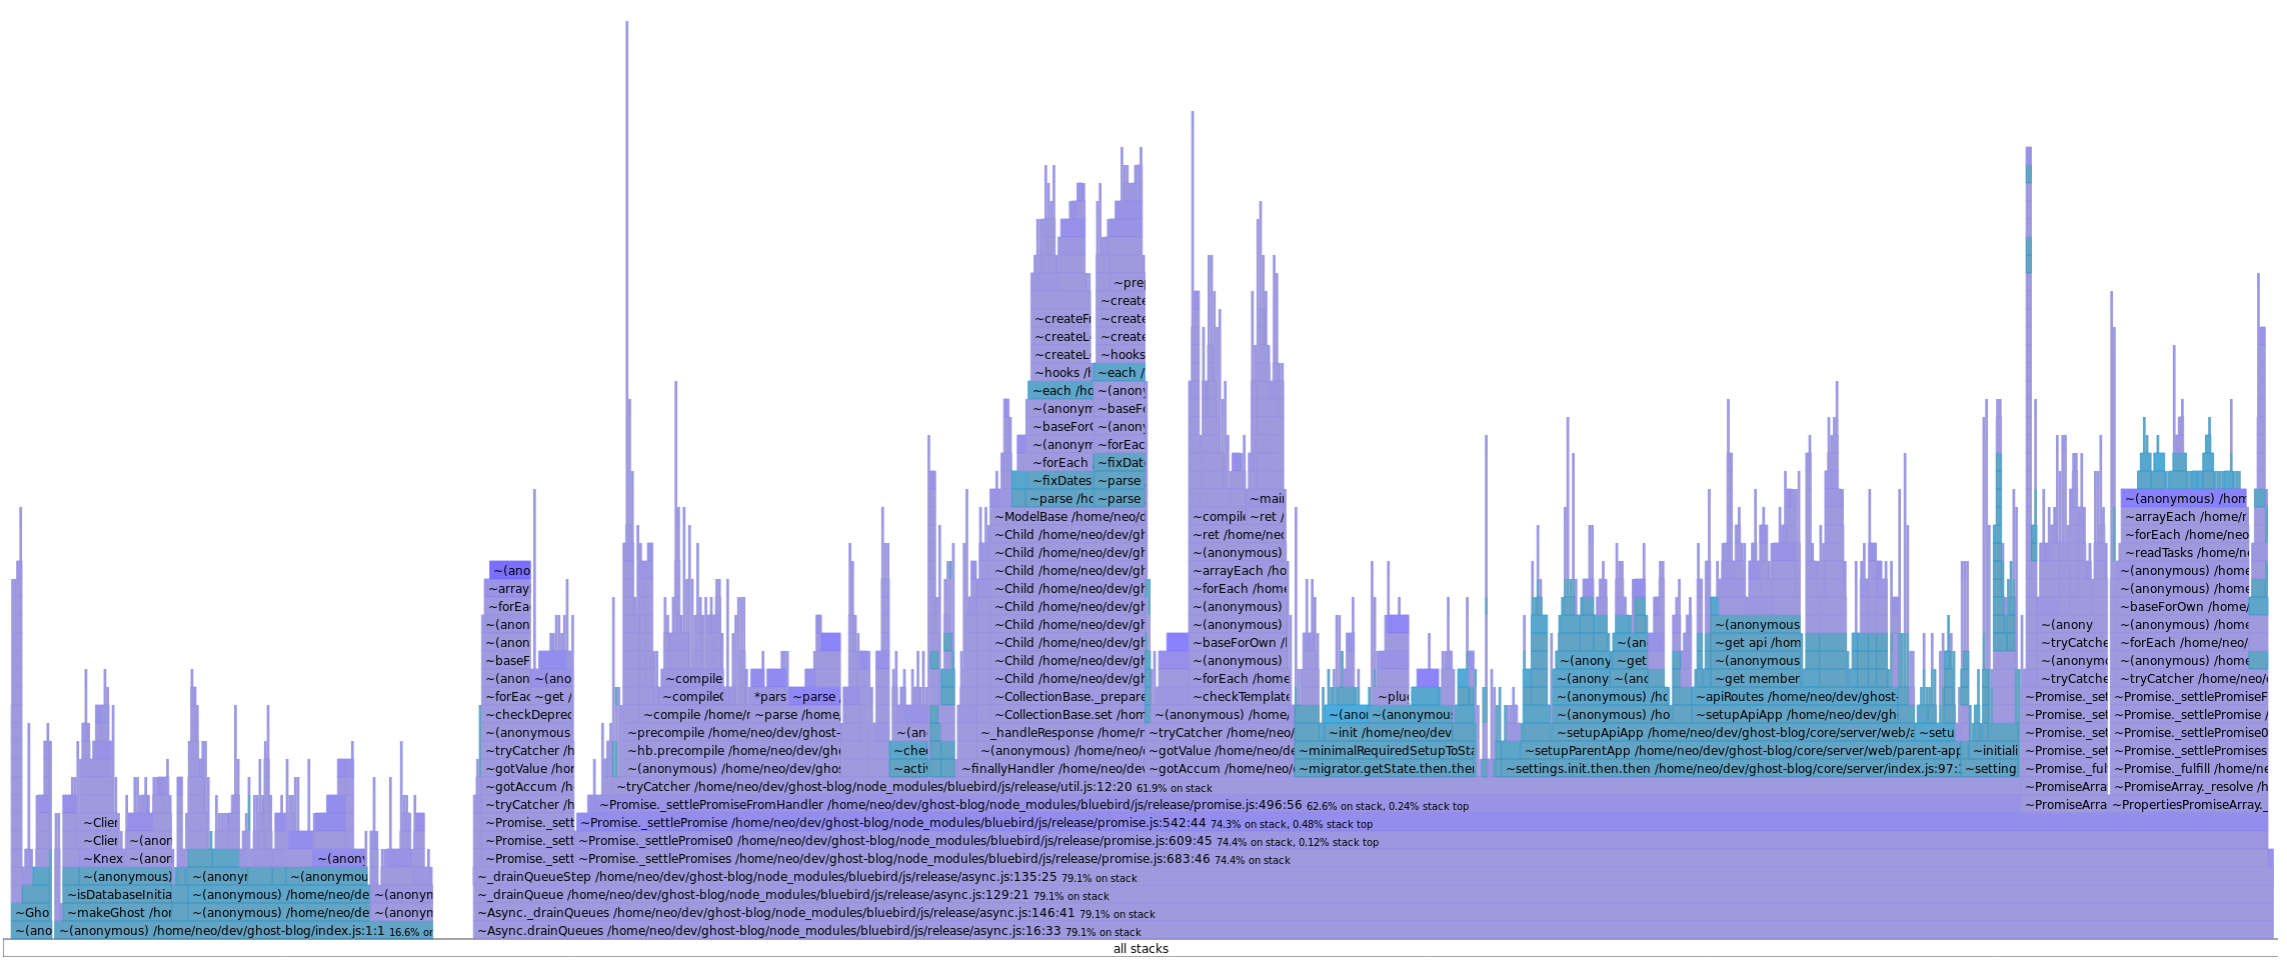
Cool! That entire flat section seems to have disappeared. And the time?
- Before: ~2.1s
- After: ~1.7s
So it's about 20% faster. (EDIT: see below)
After tidying up the code a little, I sent a pull request to the Ghost team. It actually turns out they could probably refactor that code out anyway, but it'll still need to be run once, and this helps with that.
I often find there's a lot of low hanging fruit hanging around, so I've still got some more changes to send in. Code optimization is very much an iterative process so you just rinse and repeat on the steps above.
EDIT: I received a comment a day after it was merged and the benefits were even greater on other machines. I have the latest gen i7 processor, but one of the Ghost team reports a drop from 4.5s to 2.2s on their laptop!
If you find this post useful, I'd love to hear from you via Twitter or email!