
Red flags in website performance
When a client asks me to take a look at their site, I start off by throwing it into a bunch of services to analyze the performance.
One of my favorites is GTmetrix because it has a lot of useful metrics and visualizations. The most useful one that I use is the waterfall. It lists each request the page makes, along with timings and headers. The visualization allows you to see where the obvious bottlenecks are in page load time. Below are some of the things that stick out to me when I assess these waterfalls.
(Note: I am not sponsored by GTmetrix but they do have a great tool.)
Long waiting time
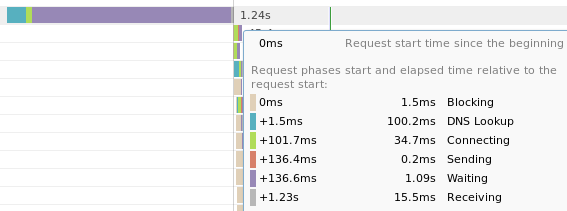
The Waiting time is how long it takes the server to process the request. In static websites, this isn't much of an issue because the web server just needs to serve up the static asset. In dynamic applications, things like data processing or DB queries are time consuming tasks that drive up the wait time.
As you can see in the image above, 1.09 seconds out of the total 1.24s was spent waiting for the web server to process the request and begin to return a response.
Reducing this time is very application specific but common things to look at include:
- Reducing the number of DB queries performed per page load by caching the result
- If a DB query does need to be performed, see if an index can help you do it faster
- Upgrading your software to faster versions (like PHP)
- Using faster algorithms or dedicated, well-tuned libraries
- Doing less and simplifying your code
Sometimes, it's actually just better to convert part of your dynamic site to a static site. For example, if the frontpage data only changes every 24 hours, you don't need to recalculate it on every page load. You could export it to a static file and serve that instead, with some frameworks having support for this. Rails has the actionpack-page_caching gem.
It's the same with sites powered by WordPress. Most people use it to create what should essentially be a static site, but yet requests still hit the PHP-FPM engine and take more time than they should. By using a plugin like W3 Total Cache, it becomes a pseudo-static site for faster processing.
A lot of the work I have done at Nomad List and Remote OK is profiling pages on the site and trying to reduce the PHP load time. You can read about that in my Profiling PHP apps and PHP Flame Graphs blog posts.
Blocked requests
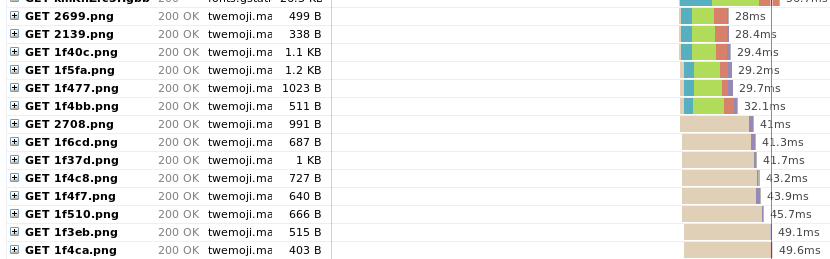
A Blocked request means it sat in the browser's queue before being sent off. The main reason for this is hitting the maximum HTTP/1.x connections per host. With HTTP/2, it now opens 1 connection per domain but the requests are multiplexed meaning the they don't run into the limitation previously mentioned. This is why HTTP/2 is so great, and you should definitely enable it on your server.
This is actually an issue I'm particularly trying to solve for my own website. The image above is for my own frontpage and you can see that 6 requests to the same host are sent off but the others are blocked until there are free connections. According to this Chrome issue, it indeed uses a maximum of 6 per host.
I use Emoji CSS to load in the emoji images. Unfortunately, MaxCDN was configured to have HTTP/2 disabled so all the images are loaded over HTTP/1.x. I filed an issue on GitHub and I am waiting for resolution.
Nginx has great support for HTTP/2, and can be enabled within a minute. Apache also has support but requires a custom-compiled version. It's important to also look at any other services you use, like a CDN, and make sure it's enabled on there too.
Lack of compression
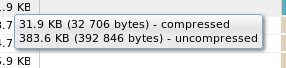
Compression reduces the size of your page by running the components through things like GZIP or Brotli compressors. The compressed content is sent and then decompressed by the browser. Because there is less to download over the network, the overhead of compressing and decompressing is nearly always worth it.
Had the asset in the image above not been compressed, I would be downloading over 10x more just for that one request!
This is one of the best ways you can reduce the total download size of your page and speed up your site. In GTmetrix, hovering over the size column in the waterfall tells you if the asset was compressed or not. You can also check out the response headers to see if there is content-encoding header. Enabling it depends on your web server, or if you use a CDN, but it's definitely something to take a look at.
Number of requests
This one becomes quite obvious from the amount of scrolling I have to do to get to the bottom of the request list. I often find a site will just incur too many requests, often from loading every image on the page. By implementing things like lazy loading, you can defer the loading until it's actually about to enter the viewport.
It also pays to take a look at any extra plugins you're including. I recently had a client who came to me to optimize their Shopify site. Taking a look at the theme code, I found several external plugin files being included that weren't actually used anymore. Each of these included JS snippets would fire off more requests and so on. I deleted them and it cut the number of redundant requests by 30%.